


Long ago, King Solomon coined the proverb “The sun rises and sets, and then hurries the next morning to rise again.” Don’t we find that with trends? They come and go and come back again in all aspects of our society. Think of new releases of old movies or the current interest in Doc Martens. Trends also recur in education. Rubrics were first used in the late 1970s and found their way back into classrooms in the mid-1990s. Then were put in detention for 15 years and resurfaced in the early 2010s. We’ll see you in the late 2020s?
I’m in my early 30s and one trend that has circled in my lifetime is Pokemon. In 1997, my youngest brother TJ came home every day from school to watch Pikachu battle some unknown villain whose name sounded like a sneeze. Fast forward to 2017, and these Japanese cartoon figures are on cards that hide in the desks and backpacks of students from Vancouver to St. John. Can they be used to bolster Math? I think so! Instead of leaving them in the backpacks till recess, have your students take them out and ask to borrow a few for Math class. Last fall, my teaching partner Christina P and I created a lesson that includes Data Management and Number Sense. Check off Mean/Median/Mode, Graphing and Coordinates from the list of concepts that need to be covered in math class. It’s totally legit. Skeptical? Don’t be. Here’s how you can do it too with just a computer.
- Start with Google Earth and get a screenshot of your school yard. If you’re using Microsoft, look for the Snipping Tool in the magnifying glass in the bottom left corner. If you’re a Google board, then lucky you. There’s an app for that! Grab a screenshot of your school yard, and copy/paste it into Google Drawings or Publisher. Stretch the picture out to cover most of your page but leave an inch or two of white space around the edge. You’ll see why in a moment.
- Then, click on the “insert” tab at the top, find the “table” icon, and make a 10 x 10 table and drag it over the picture. Stretch it out so it covers the screenshot of your school yard. If your students aren’t ready for a 10×10 table, then scale it down to 6 x 6, or jump up to 15 x 15.
- Print it out and have your students pencil in coordinates along the bottom and left side of the table. They now have a working grid of their own school yard! I see a real-world connection here every time they step outside for recess.
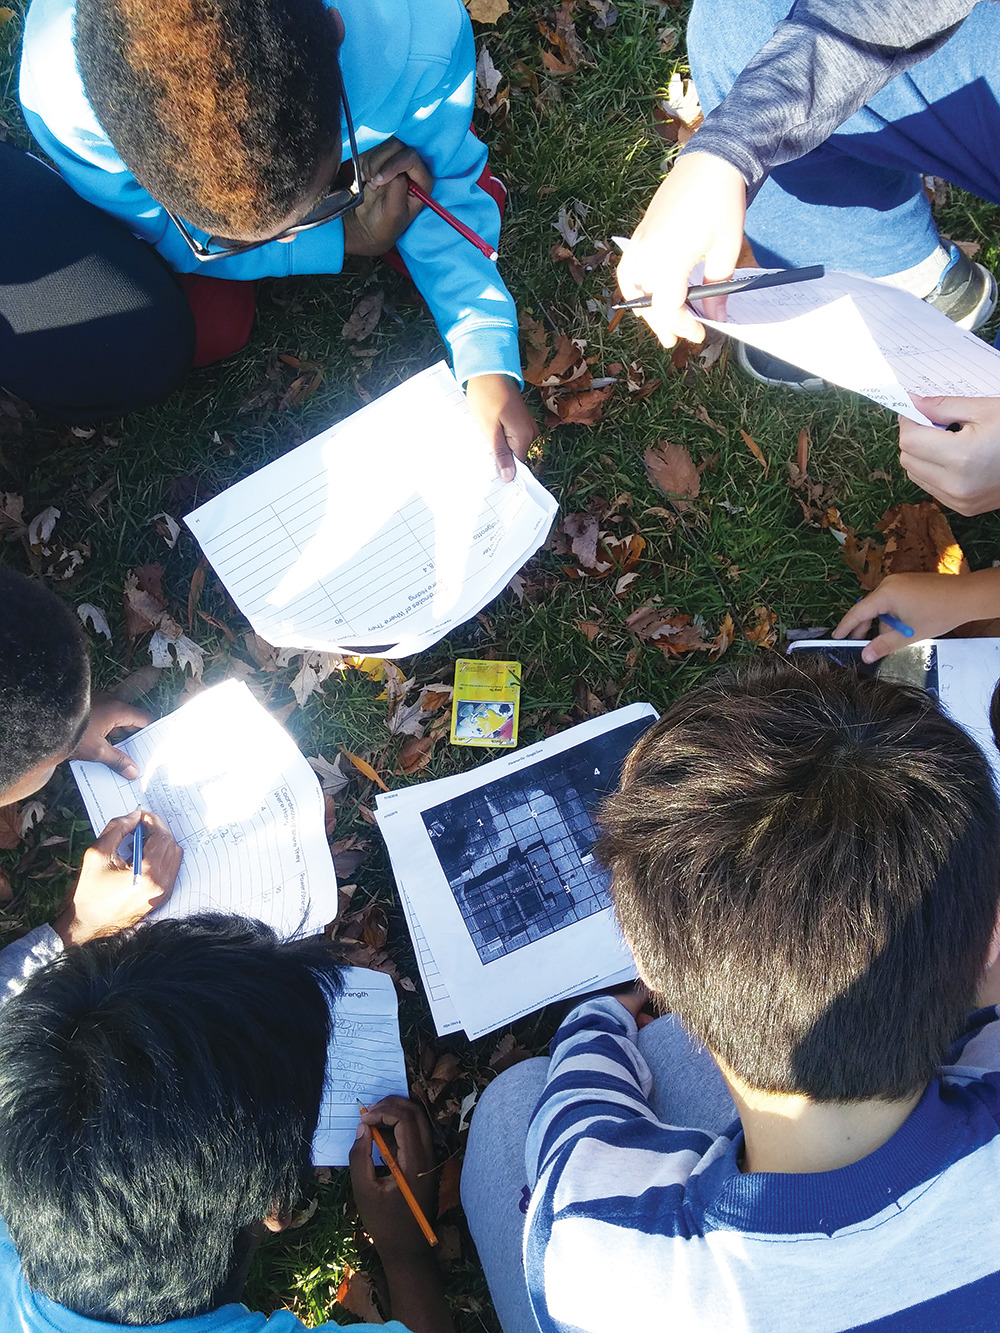 Then comes the fun part. We piggybacked off the massively popular Pokemon Go app, where you use your cell phone to search for Pokemon characters around your neighbourhood. Admittedly, I’ve yet to download and play the game, but I understand the concept. Students were given a write up (find it at bit.ly/pgo-tindale) that told students that Pokemon characters were hiding around the school yard and we needed their help to locate them. We borrowed a dozen cards from the hundreds circulating in our classes, and chose twelve plot points on our schoolyard grid—one plot point per card. Fifteen minutes earlier, we were outside with five minutes left in lunch recess and when the bell rang and students were walking in from the schoolyard, we circled in behind them and discreetly dropped cards in the vicinity of our predetermined plot points. It helped that there were two of us because we could cover more ground than one person could. Once attendance was taken, we handed out the pieces of paper that had the activity’s instructions and our schoolyard grid and had students label their graphs with letters on the x-axis and numbers on the y-axis. When they finished and the cheering dimmed, students lined up at the door, armed with pencils and their papers. It was refreshing to see boys racing to the door, ready to find and corral those Pokemon characters. We walked out of the school surprisingly calmly to a central meeting spot. It’s interesting that behaviour issues often lessen when students are engaged and having fun. We gave a 5,4,3,2,1 countdown and off went the stampede. Classes inside were peeking out their windows, curiously wondering why students were running across the yard with clipboards. I’m confident that if any superintendent or admin questioned my students, 95% of them could say we’re looking for Pokemon cards and we’re plotting the spot in the yard where they are hiding. The educational goals and success criteria were as clear as the sun that filled the outdoor classroom they were learning in that afternoon.
When most groups had found the characters, we came back inside and took up the 12 plot points. An extension to the activity is mean, median and mode because each Pokemon card is a character with varying degrees of “damage” ranging from 10 to 200+ points. On the handout we distributed, there were columns to write the character’s name, their coordinates and their health damage. These health damages were the key to tying in the number sense. What was the mean average of the 12 characters? Was there a mode? Finally, another extension activity is have students graph the health damages of the twelve characters on a bar graph. You could push them further and have them do a double bar graph of the character’s damage compared to the mean average.
When I teach workshops on creativity in the classroom, I try to end many of them with a question, which I’ll leave with you: If you were 10 years old, would you want to be in your classroom? Is your classroom dull or is it bright? Do your lessons spark creativity? Would you want to be in your own class? As sure as Solomon’s wisdom of the sun rising again tomorrow is true, you’ll have another chance to refresh your practice tomorrow morning. Be encouraged and be creative. Have a good year.
ABOUT THE AUTHOR
Ryan Tindale
Ryan Tindale is an occasional teacher in the Durham DSB in Ontario. He’s passionate about creativity and loves using technology to Ignite Learning. He’s taught over 1000 teachers and been published in numerous magazines. He has a teacher resource site at teachingsmarter.ca which has been visited by teachers in over 20 countries, and he’s connected himself as a seller on Teachers Pay Teachers offering resources to support teachers. He loves reminding teachers that Pixels affect Perception.
This article is from Canadian Teacher Magazine’s Jan/Feb 2017 issue.